


FortiView interface
FortiView lets you access information about the traffic activity on your FortiGate, visually and textually. FortiView is broken up into several consoles, each of which features a top menu bar and a graph window, as seen in the following image:
FortiView Application console sorted by Sessions (Blocked/Allowed)

The top menu bar features:
- a Refresh button, which updates the data displayed.
- a Filter button, for filtering the data by category.
- a Settings button (containing additional viewing settings and a link to the Threat Weight menu).
-
a drop-down menu of different views:
- Time Display (options: now, 5 minutes, 1 hour, or 24 hours),
- Table View
- Timeline View
- Bubble Chart
- Country Map
|
|
Certain views are only available in specific consoles. |
The FortiView graph
The graph window can be hidden using the X in the top right corner, and re-added by selecting Show Graph. To zoom in on a particular section of the graph, click and drag from one end of the desired section to the other. This will appear in the Time Display options as a Custom selection. The minimum selection size is 60 seconds.
|
|
Only FortiGate models 100D and above support the 24 hour historical data. |
Bubble chart visualization

Notes about the Bubble chart:
- It is possible to sort on the Bubble chart using the Sort By: dropdown menu.
- The size of each bubble represents the related amount of data.
- Place your cursor over a bubble to display a tool-tip with detailed info on that item.
- You can click on a bubble to drilldown into greater (filtered) detail.
Links created between FortiView and View/Create Policy
The Policy column in FortiView consoles and the Log Viewer pages includes a link, which navigates to the IPv4 or IPv6 policy list and highlights the policy.
Right-clicking on a row in FortiView or the Log Viewer has menu items for Block Source, Block Destination and Quarantine Source where appropriate columns are available to determine these values. When multiple rows are selected, the user will be prompted to create a named Address Group to contain the new addresses.
When the user clicks Block Source or Block Destination they are taken to a policy creation page with enough information filled in to create a policy blocking the requested IP traffic.
The policy page will feature an informational message block at the top describing the actions that will be taken. Once the user submits the form, the requisite addresses, groups and policy will be created at once.
If the user clicks on Quarantine User then they will be prompted for a duration. They may also check a box for a Permanent Ban. The user can manage quarantined users under Monitor > Quarantine Monitor.
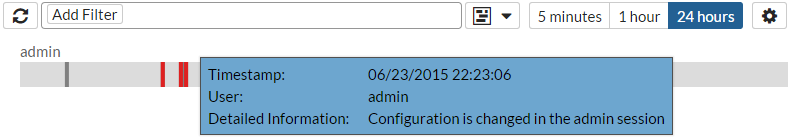
Visualization support for the Admin Logins page
A useful chart is generated for Admin login events under FortiView > Admin Logins. You can view the information in either Table View or Timeline View (shown below). In Timeline View, each line represents on administrator, with individual sessions indicated per administrator line. When you hover over a particular timeline, detailed information appears in a tooltip.
Realtime visualization
To enable realtime visualization:
- Click on the Settings icon next to the upper right-hand corner and select Auto update realtime visualizations.
An option is displayed to set the Interval (seconds). The maximum value is 300.
- Enter a desired Interval and click Apply.
Accelerated sessions
When viewing sessions in the All Sessions console, information pertaining to NP4/ NP6 acceleration is now reflected via an appropriate icon in the table. The tooltip for the icon includes the NP chip type and its total number of accelerated sessions.
Filtering on accelerated sessions
You can filter the console on 'FortiASIC' ('Accelerated' versus 'Not Accelerated') sessions.
WHOIS Lookup anchor for public IPv4 addresses
A Reverse IP lookup is possible using the WHOIS lookup icon available when you mouse over a public IP address in a FortiView log. If you left-click on the lookup icon, a new tab is opened in your browser for www.networksolutions.com, and a lookup is performed on the selected IP address (this option persists after drilling down one level in FortiView).