


Topology
You can see the Security Fabric topology in the FortiGate GUI, in the Security Fabric menu. You can choose the Physical Topology or Logical Topology views. In both topology views, you can hover over device icons and use filtering and sorting options to see more information about devices and your organization's network. To view the complete network, you must access the topology views on the root FortiGate in the Security Fabric.
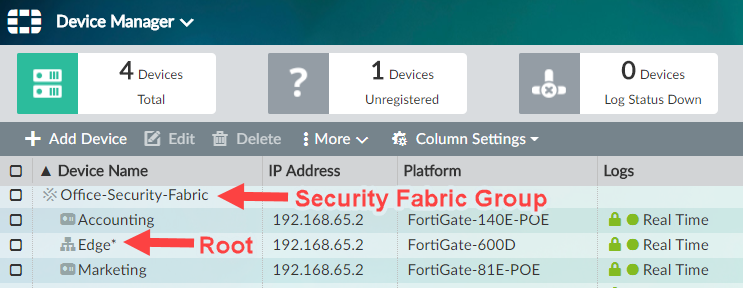
You can also see the Security Fabric topology in the FortiAnalyzer GUI. In the FortiAnalyzer GUI, select Device Manager. The FortiGate devices in the Security Fabric are shown as part of a Security Fabric group. An asterisk (*) appears beside the root FortiGate in the Security Fabric. To see the topology of the Security Fabric, right-click on the Security Fabric group and select Fabric Topology.Only Fortinet devices are shown in the Security Fabric topology views. The following image shows the FortiAnalyzer GUI.
The WAN Cloud icon
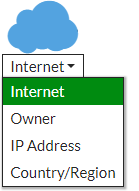
The WAN cloud icon, in the Physical and Logical Topology views, allows you to receive destination data from the following options in the drop-down menu: Internet, owner IP address, and country/region. These options are available only in the Physical Topology view, when you select Device Traffic in the menu in the top right corner.
When you set the WAN cloud icon to Owner, the destination hosts are simplified to a fixed size donut chart. This chart shows the percentage division between Internal hosts (with private IP addresses) and Internet hosts. To see which color represents each host, hover over either color. To zoom in on the total number of hosts, click on the donut graph. To see more data for owner details in FortiView > Destinations, right-click and select Destination Owner Details. You can see the Internet Hosts in the screen shot below.

Switch stacking
FortiAP and FortiSwitch links are enhanced in the Security Fabric’s Logical and Topological views to show Link Aggregation Groups for the Inter-switch Link (ISL-LAG). This makes it easier to identify which links are physical links and which links are ISL-LAG. To quickly understand connectivity when you look at multiple link connections, ISL-LAG is identified with a thicker single line. To identify ISL-LAG groups with more than two links, you can also look at the port endpoint circles as references.
FortiAP and FortiSwitch integrations
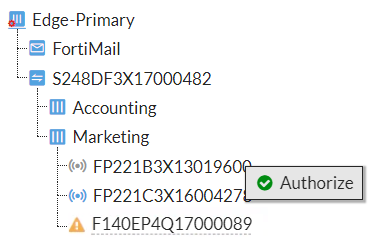
You can see newly discovered FortiAP devices and FortiSwitches in the Security Fabric Topology widget as grayed-out icons, and you can click on any discovered device to authorize it. Once it's authorized, the device icon changes to blue. The following image shows the Security Fabric Topology widget.
The following image shows the same device in the Physical and Logical Topology views.
For an authorized FortiAP, you can right-click to: either Deauthorize or Restart the device. For an authorized FortiSwitch, you can choose from the following management options: Deauthorize, Connect to CLI, Restart or Upgrade.
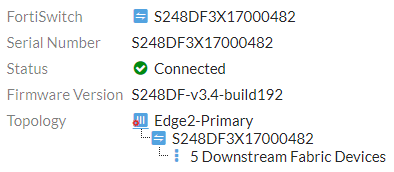
You can hover over the icon to show the device tooltips. Device tooltips show the connection status and firmware version. FortiSwitch also includes the faceplate and includes the physical port name and number of any devices connected to the FortiSwitch. The following image shows a FortiSwitch device tooltip.
Distinguishing client traffic from server traffic
The Physical and Logical Topology view shows servers and server clusters as rounded square shapes instead of bubbles, and they are grouped separately from endpoint devices to allow you to easily distinguish server traffic from other client traffic. Devices are grouped by device type. For example: Android phones, Apple phones, and Windows PCs.
Identifying compromised hosts from the topology views
To view compromised hosts on your network and identify threats based on severity, you can click the Compromised Hosts icon in the Physical and Logical Topology views. To filter the compromised hosts by Device Traffic, Device Count or IOC Score, you must set the Bubble Option, located in the top-right corner. The host bubbles show different colors based on the IOC severity level. Confirmed threats appear in an actionable top-down list, located on the right side of the GUI, arranged based on threat severity.
The FortiAnalyzer in the Security Fabric retrieves the detected Indicators of Compromise (IOCs) from FortiGuard services. You can also view compromised host information in the FortiAnalyzer, in FortiView > Threats > Compromised Hosts.
View the Physical Topology
The Physical Topology view shows the devices in the Security Fabric and the devices they are connected to. You can also select whether or not to view access layer devices in this topology.
To see the Physical Topology, in the root FortiGate GUI, select Security Fabric > Physical Topology.

The Physical Topology view displays your network as a bubble chart of interconnected devices. These devices are grouped based on the upstream device they are connected to. The bubbles appear smaller or larger, based on their traffic volume. You can double-click any bubble to resize it and view more information about the device.
FortiGate devices and other networking devices are depicted as boxes. You can hover over the icon for each FortiGate to see information, such as serial number, hostname, and firmware version. You can hover over the bubbles of other devices to see information about them, such as name, IP address, and traffic volume data.
You can click the Compromised Hosts icon , to view compromised hosts on your network and identify threats based on severity.
Security Fabric Rating recommendations are also shown in the topology, beside the icon of the device the recommendations apply to.
View the Logical Topology
The Logical Topology view is similar to the Physical Topology view, but it shows the network interfaces, logical or physical, that are used to connect devices in the Security Fabric.
To see the Logical Topology, in the root FortiGate GUI, select Security Fabric > Logical Topology.
The Logical Topology view displays your network as a bubble chart of network connection points. These devices are grouped based on the upstream device interface they are connected to. The bubbles appear smaller or larger, based on their traffic volume. You can double-click any bubble to re-size it.
FortiGate devices and other networking devices are depicted as boxes. You can hover over the icon for each FortiGate to see information, such as serial number, hostname, and firmware version. You can also see each FortiGate interface that has upstream and downstream devices connected to it. You can hover over the name of an interface to see its IP address, network (subnet), and role.
You can click the Compromised Hosts icon, to view compromised hosts on your network and identify threats based on severity
Security Fabric Rating recommendations are also shown in the topology, beside the icon of the device the recommendations apply to.
Filter the topology views by specific criteria
You can use filters to narrow down the data on the topology views, so you can find specific information.
Search
In the drop-down menu to the right of the Search field, select one of the following:
- Device Traffic
- Device Count
- Device Type
- Vulnerability
- Threat Score
- IOC Score
- No Device
Time period
To filter the view by time, in the time period drop-down menu, select one of the following:
- now
- 5 minutes
- 1 hour
- 24 hours
- 7 days
Traffic options
To sort the topology by traffic options, in the Sort By drop-down menu, select one of the following:
- Bytes (Sent/Received)
- Packets (Sent/Received)
- Bandwidth
- Session
Using the Search bar to find information in the topology views
The search bar, located above the Physical and Logical Topology views, can help you easily find what you're looking for in the network topology and quickly resolve security issues. For example, you can search for unauthorized hosts and then decide which devices to authorize or remove from your network. The search highlights devices that match your search criteria, and grays out devices that don't match.
To see a list of items that you can search for, mouse over the search bar and a tooltip appears that shows Searchable Information list, organized by host and by Fortinet device type. You can search for the following:
- For hosts, you can search for host information, such as status, host name, and server.
- For FortiGate, you can search for device information, such as serial number, host name, and management IP address.
- For FortiSwitch and FortiAP, you can search for device information, such as serial number, name and OS version.
